Map
The map page is used to view your assets against your POIs (Points Of Interest). Navigation to the Map page can be found on the top navigation bar.

The main layout of the Map page consists of
The left-hand side ‘Points Of Interest’ sidebar displays a list of the POIs saved for the company selected in the ‘Selected Company’ dropdown. It also allows for searching through the POIs using the search bar. This is open by default.
The main map in the middle shows the POIs (hollow circles), mapped assets (vehicle icons) and collections of assets (numbered circles).
For more information on each icon on the map, see Map Icons below.
For guidance using the Map controls, see Map Controls for more support.
The right-hand side ‘Fleet Grid Assets’ sidebar displays your mapped/tracked assets. It also allows for searching through the tracked assets using the search bar. This is closed when the page loads.
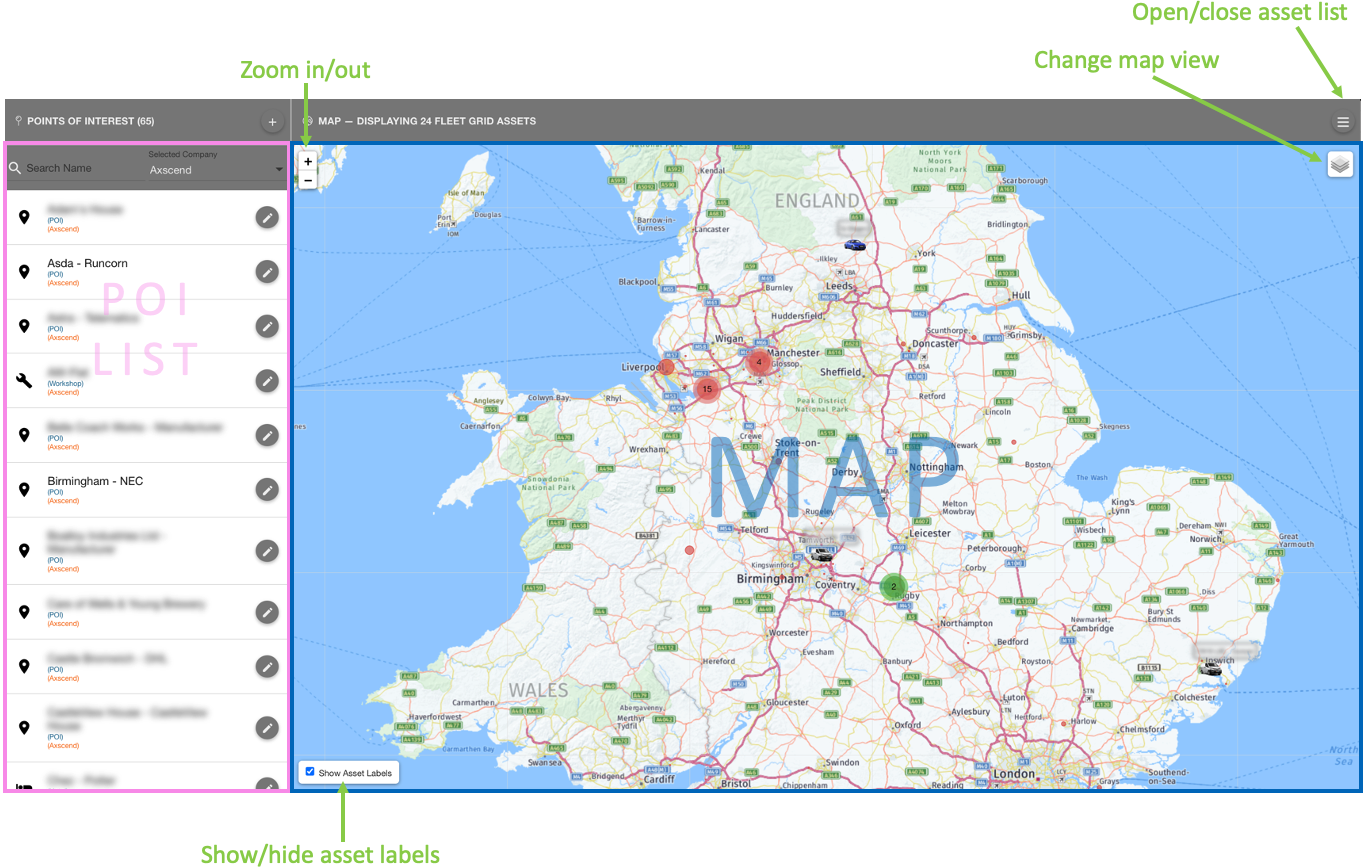
Your map might look different depending on what view you have selected. For support switching views, see Map Controls.
Map Icons
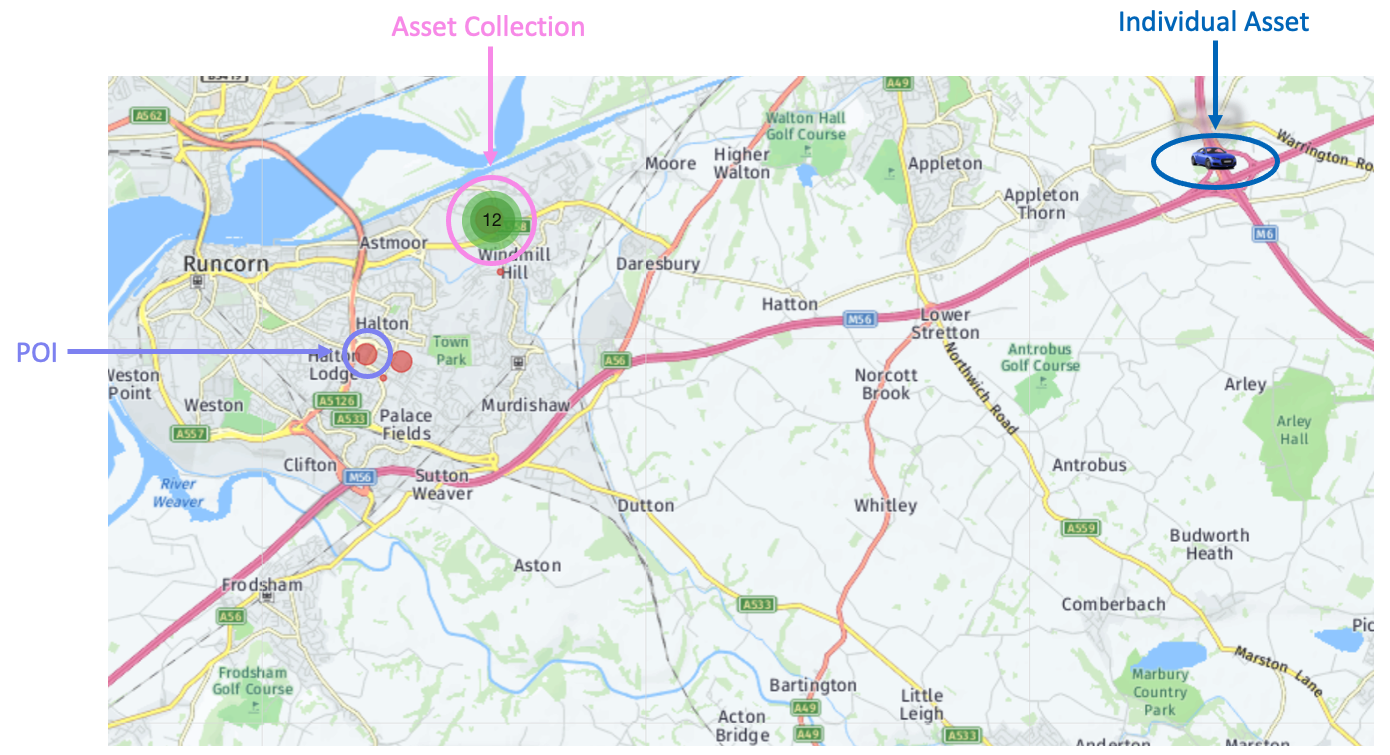
Shows a POI, collection containing 12 assets with a good status, and an individual asset.
POI
Each POI on the map is a red hollow circle (sizes vary depending on the radius applied to that POI). | 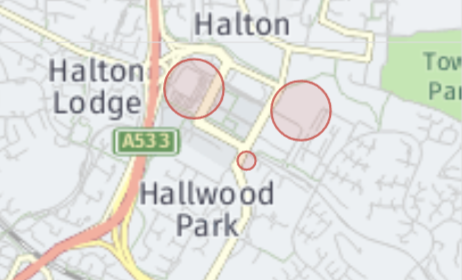 |
Asset
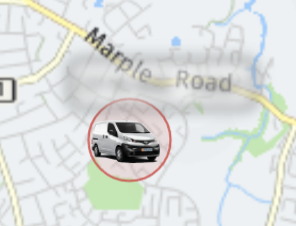
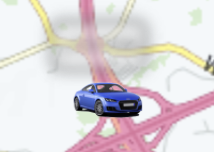
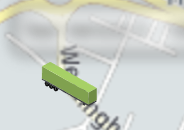
Each vehicle on the map represents an asset. These may be represented by a number of different vehicle icons depending on the asset’s | ||
 |  |  |
Assets and Collections
Larger coloured circles represent a collection of assets within the same area. Inside a collection of assets will be the total of assets inside the collection. The more your map is zoomed out, the more collections of assets you are likely to see. The colour of an asset collection will show the overall status of all assets included - therefore if one asset is VOR in the collection, the collection will be red. All assets in a collection will need to be On-Road and have an overall status of Healthy to be green. You can click on a asset collection to zoom into the area and expand the assets within that collection into individual assets. | 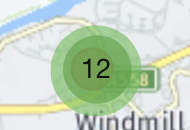 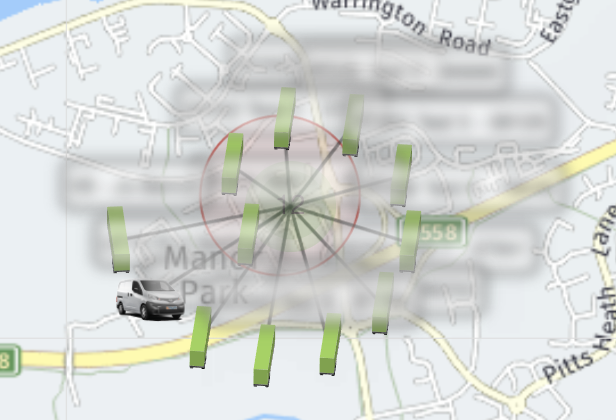 |
.png)