.png)
Mileage Analysis
For support navigating to the Analysis page see Analysis. On the Analysis page, ensure you have selected the ‘Mileage’ tab from the tab bar (the Analysis will open on this tab by default).
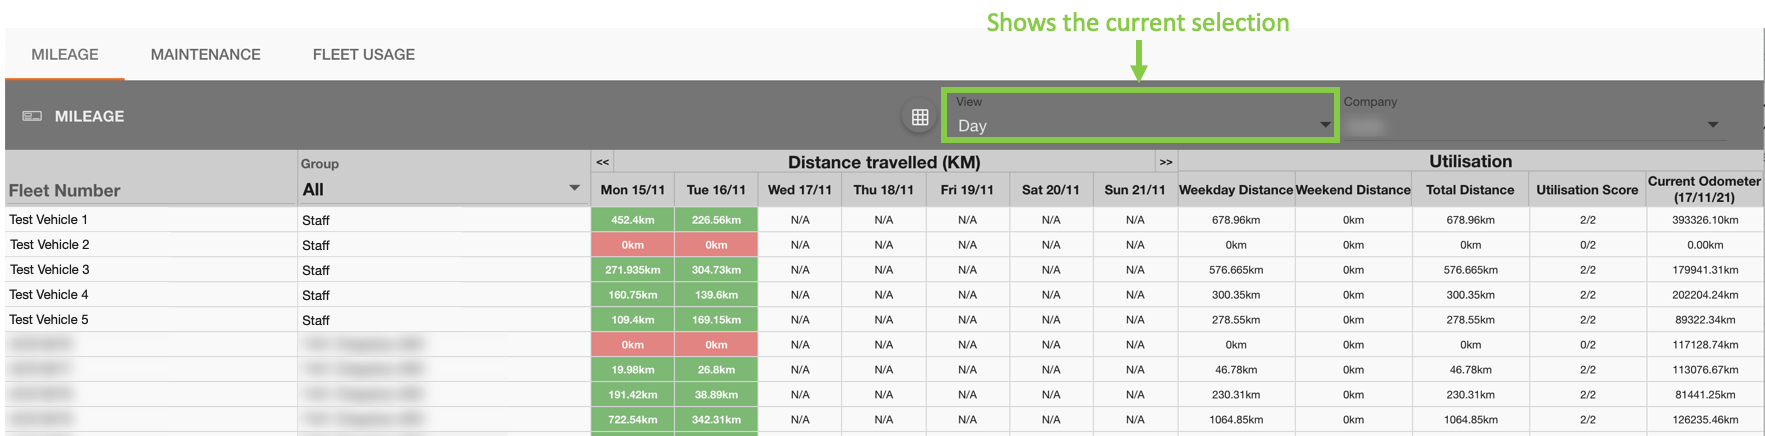
The Mileage page contains a toolbar and a sectioned analysis table. The mileage analysis table is split into the fleet section, the view breakdown and the utilisation breakdown.
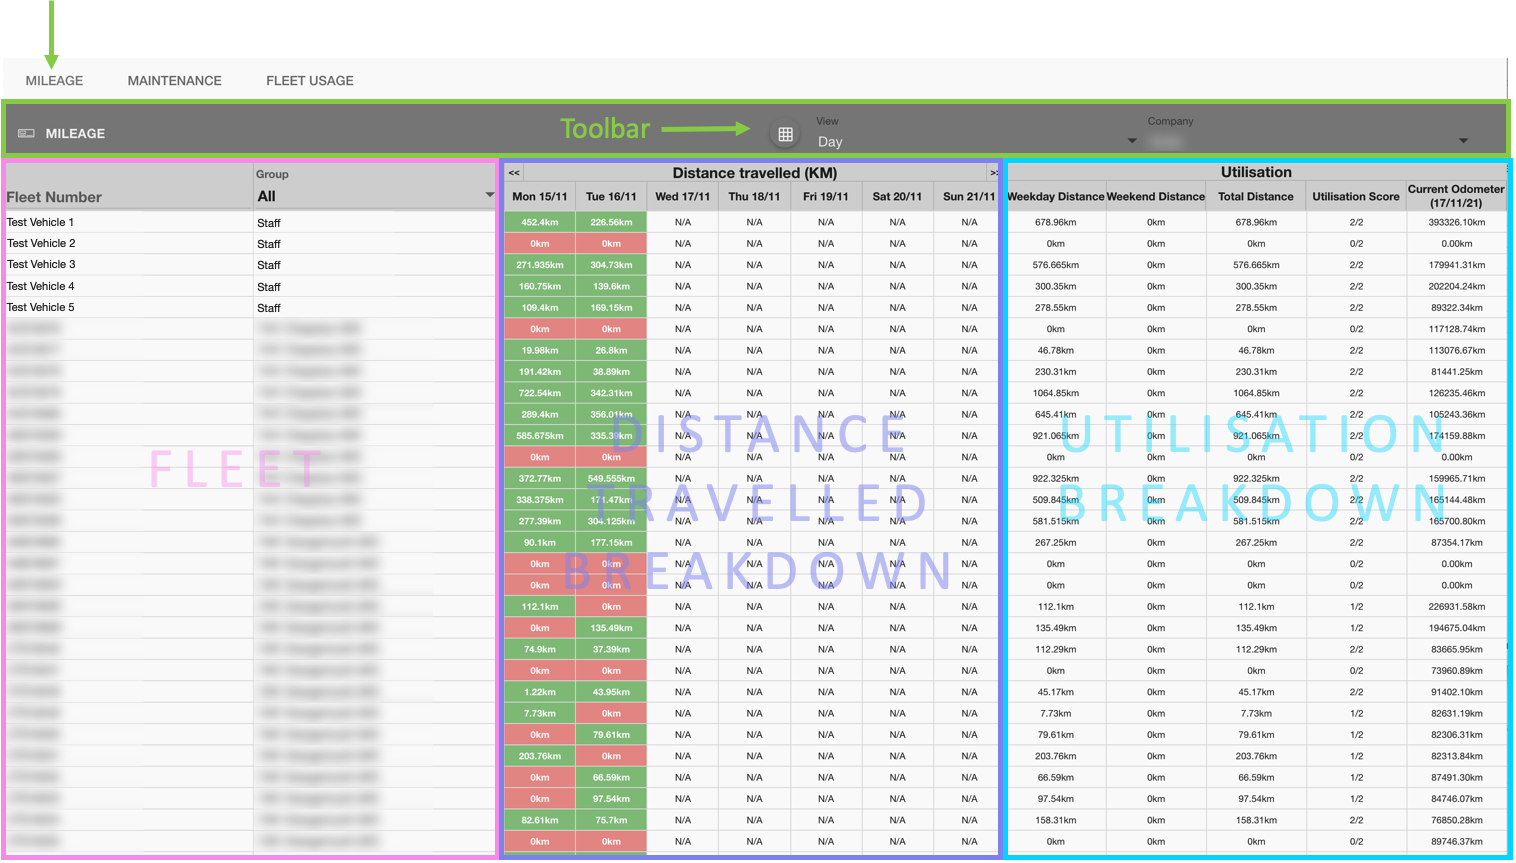
Fleet
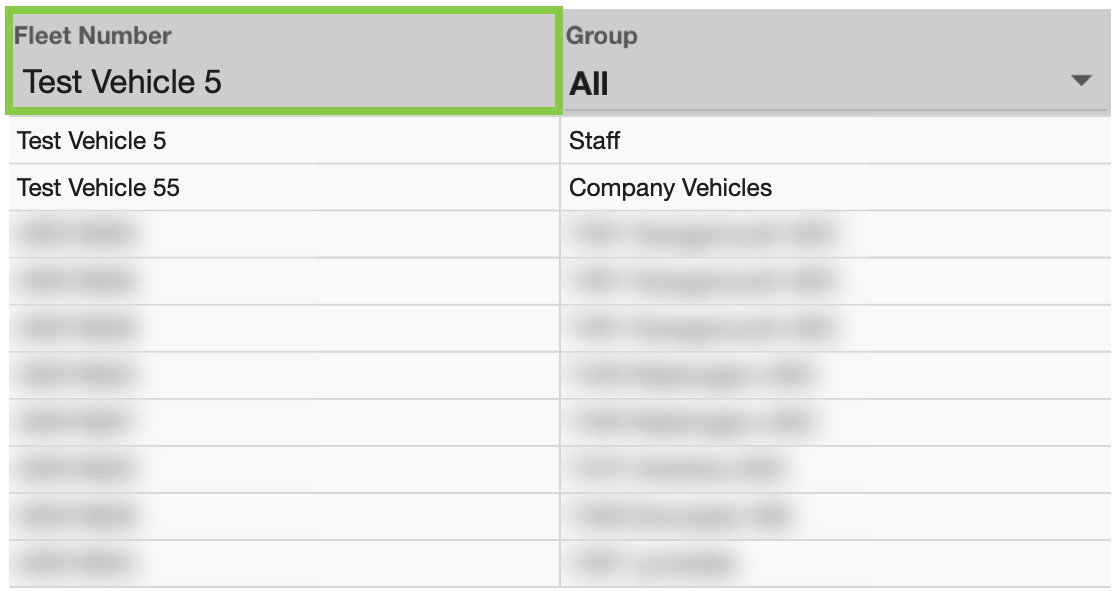
The Fleet section lists the assets in your fleet. You can filter this section by Fleet Number by clicking into the ‘Fleet Number' field and typing a value.
Or you can filter by selecting a group from the dropdown menu.
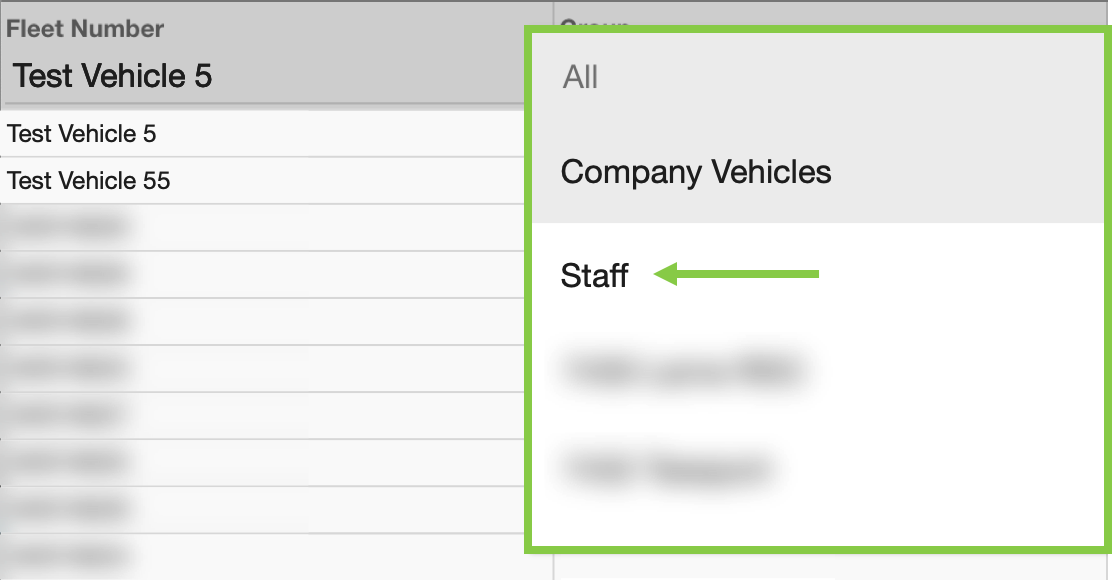
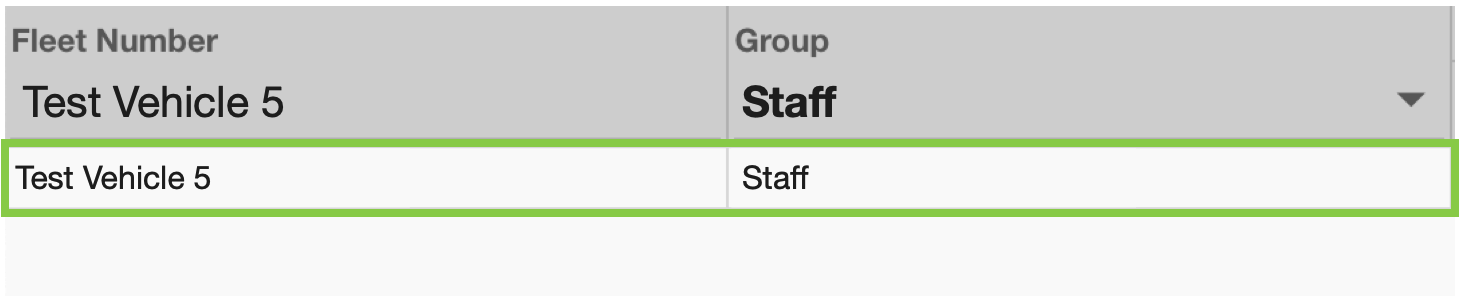
This will return the assets which match both the search criteria, and the group filter applied.
Distance Travelled
The Distance Travelled extends on the fleet section and shows a breakdown of the kilometres travelled by each asset, based on the selected ‘View’. The view will be set to ‘day’ by default but can be changed to show weekly and monthly breakdowns.
The ‘day view’ displays each day of the current week - you can skip to the previous or next week using the double chevron buttons (<< and >>).
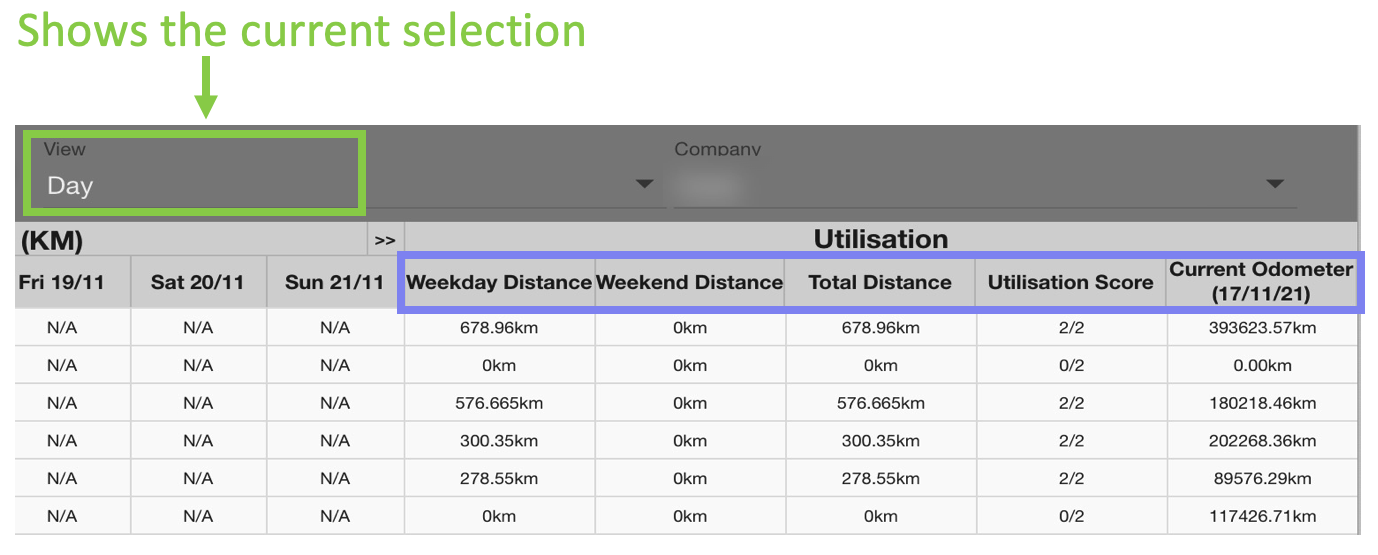
The days which have not elapsed yet will show N/A
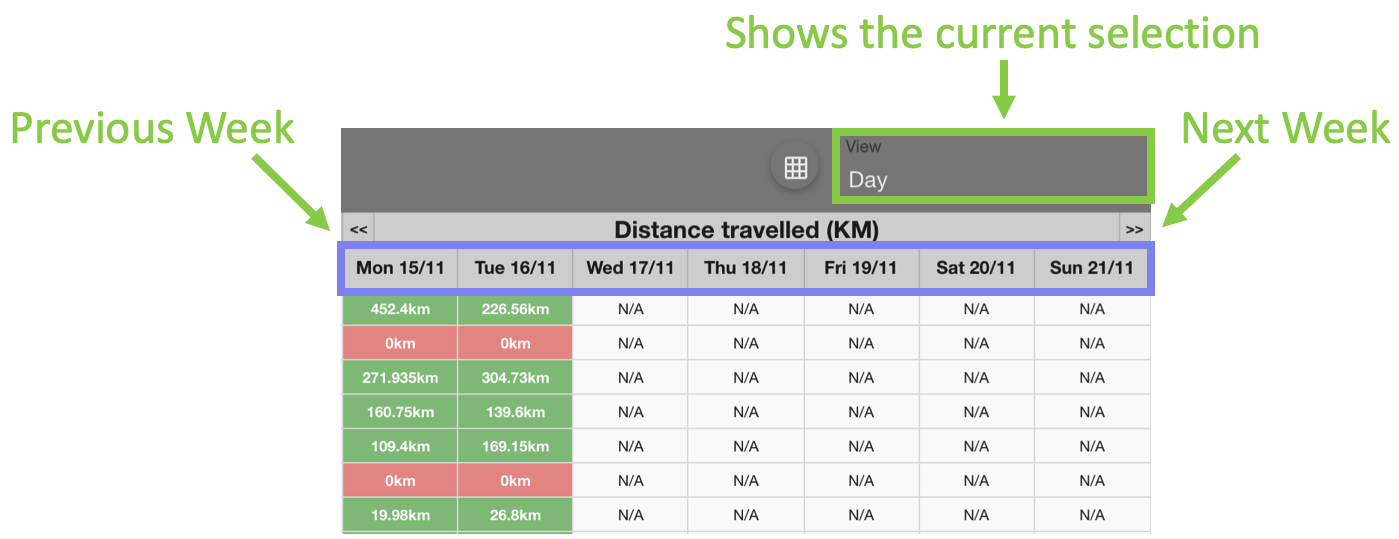
To change the selected view, click on the ‘View’ section on the toolbar.
This will open a dropdown list of the available view options: Day, Week and Month.
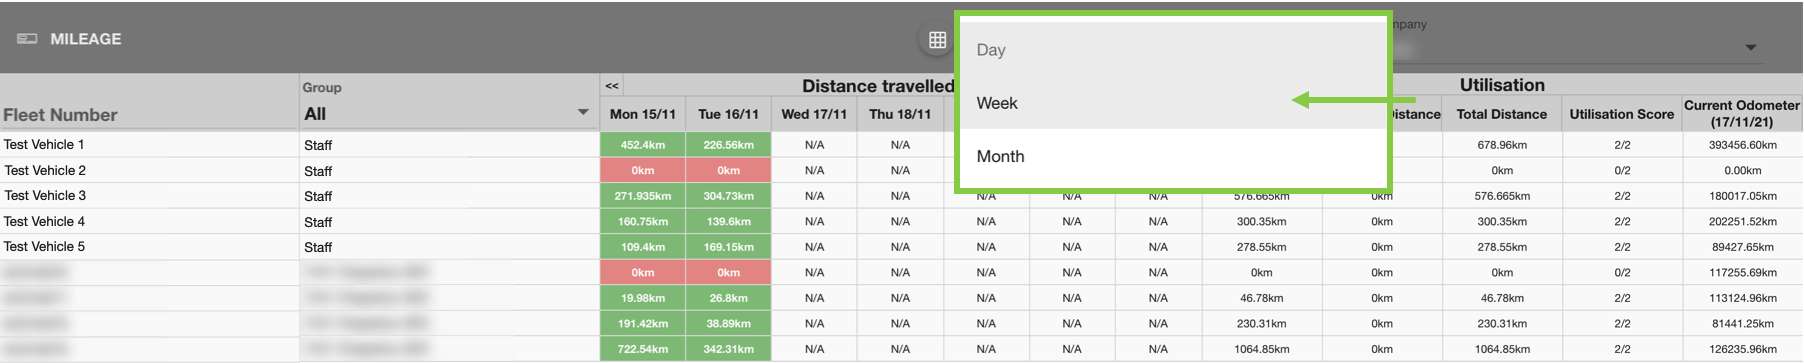
Click on the desired view; this will automatically update the mileage table. The headings will change based on which view you selected.
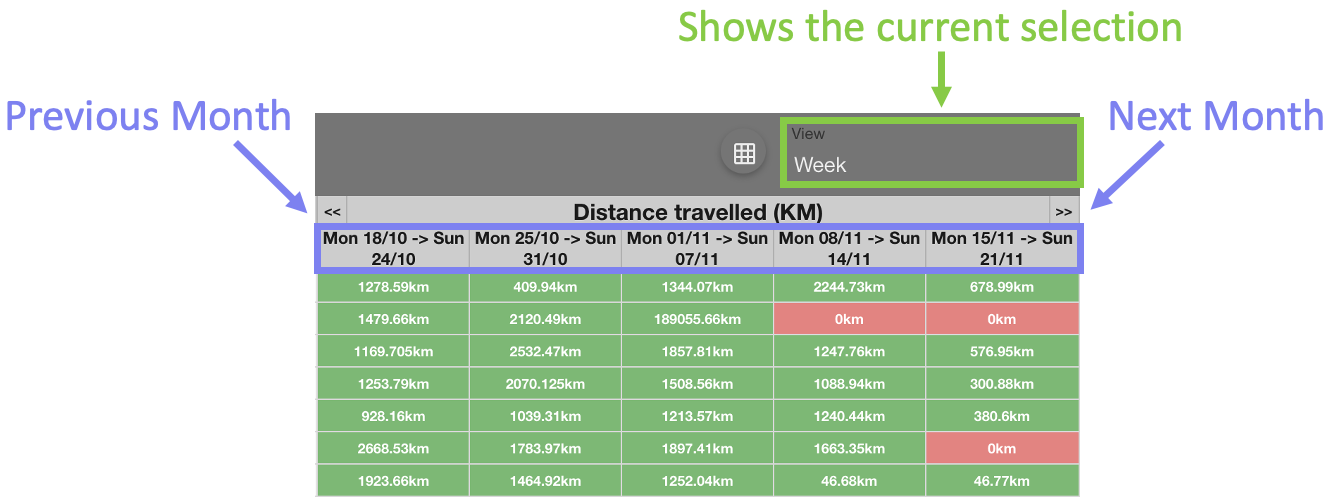
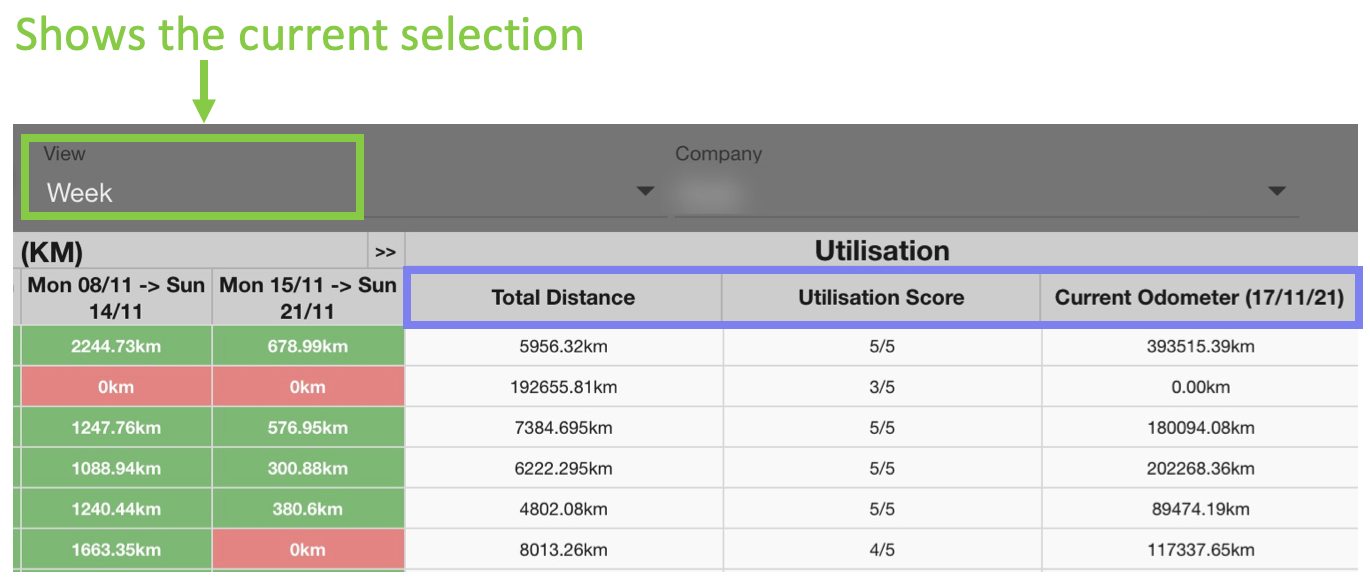
The Distance Travelled section when the View is set to week
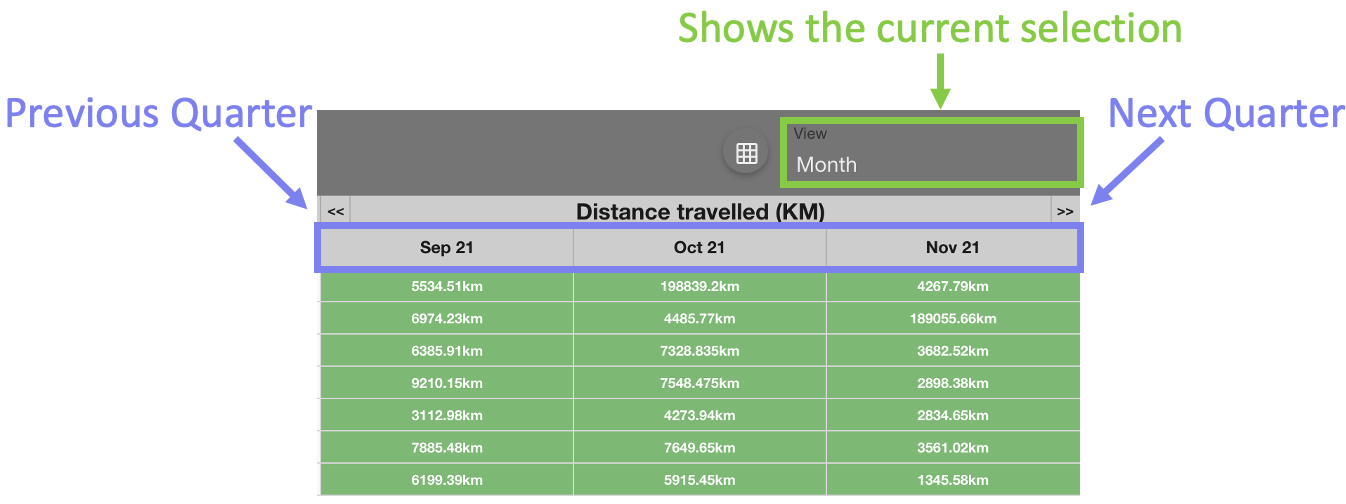
The Distance Travelled section when the View is set to month
Utilisation
The utilisation section may have different columns depending on which View is selected in the Distance Travelled section. The Total Distance, Utilisation Score and Current Odometer columns are standard with whichever view is selected.
Total distance shows the distance in kilometres travelled over the period in the Distance Travelled section.
Day view will show the total KM over the week
Week view will show the total KM over the month
Month view will show the total KM over the quarter.
The utilisation score shows how often the asset was used over the period in the Distance Travelled section.
E.g. day view will have a utilisation score out of 5, or if mid-week a score out of the elapsed days.
The current odometer shows the odometer reading for each asset at the specified date (in brackets).
The ‘day view’ has added breakdown columns on weekday distance and weekend distance.
Weekday Distance shows the distance in kilometres travelled over the period in the Distance Travelled section on weekdays only.
Weekend Distance shows the distance in kilometres travelled over the period in the Distance Travelled section on weekends only.
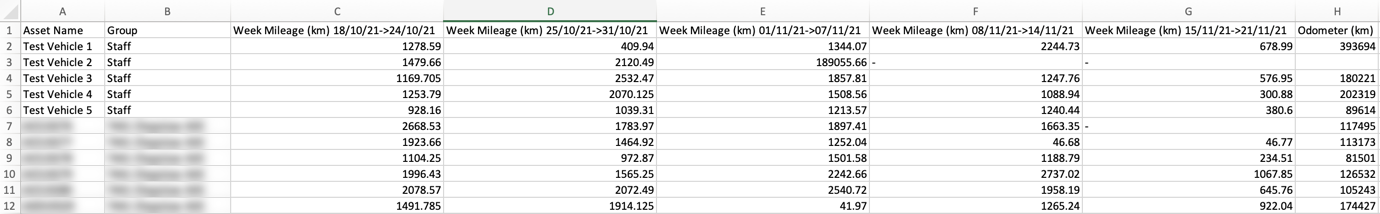
Downloading Mileage Reports
You can download a snapshot of the Mileage table as a CSV report, which will include all the table headings as columns in the CSV.
The report will be formatted the same as the current view and show the current period you have selected in the Distance Travelled section.
To download the CSV report, click on the grid icon on the toolbar.

This will begin downloading your report.
 Troubleshooting
For any issues or errors that have not been solved please Contact Axscend Support.