Fleet Usage
For support navigating to the Analysis page see Analysis. On the Analysis page, ensure you have selected the ‘Fleet Usage’ tab on the tab bar. The Fleet Usage analysis breaks down the activities of an asset each day.
The Fleet Usage analysis page is sectioned into the main breakdown table, and to the right, various controls to change the data displayed on the table.
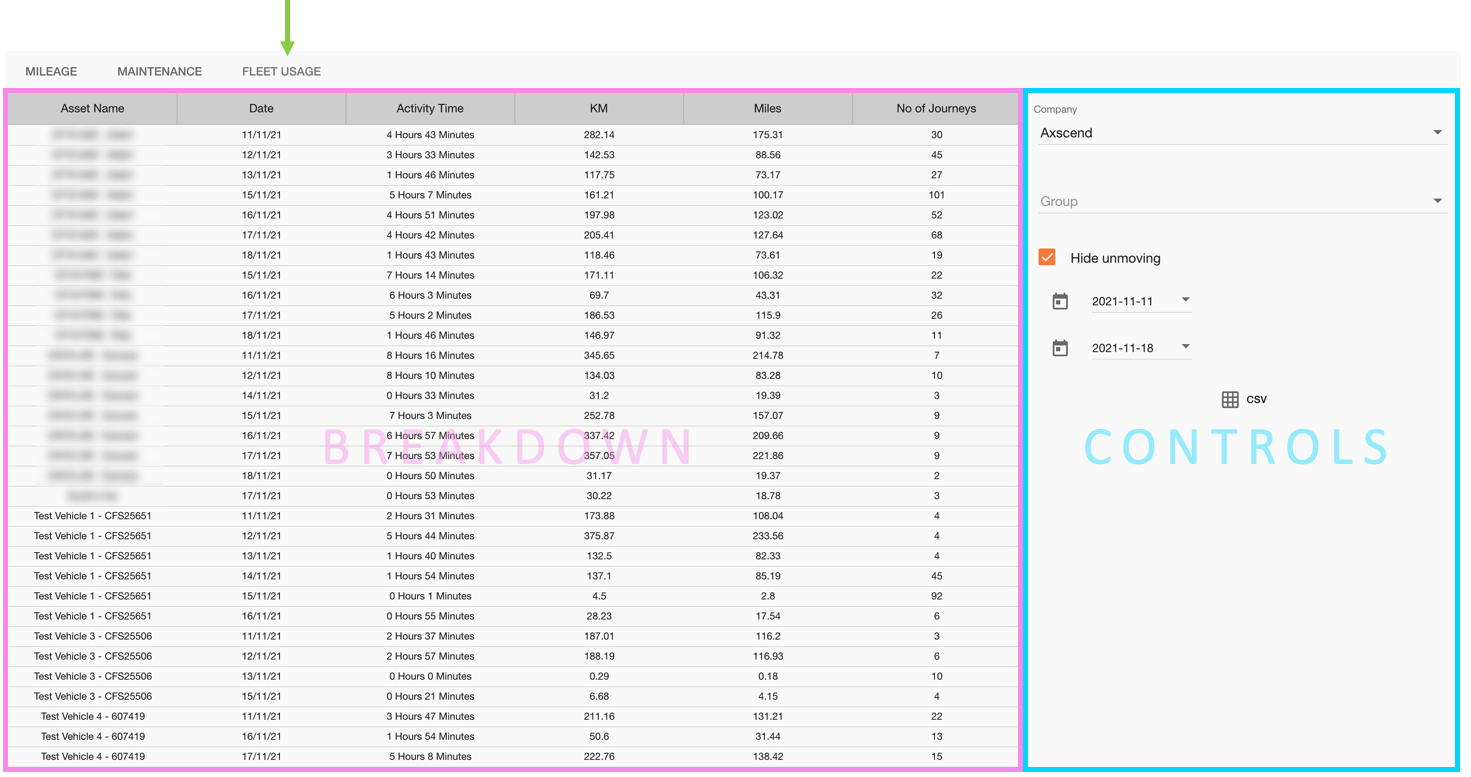
You can use the controls on the right to:
Filter specific groups (and companies, if you belong to more than one)
Hide assets with no activity
Define a custom date range
The controls section also has a CSV button to generate reports. Skip to Downloading Fleet Usage Reports for more information.
Filtering
If you are mapped to more than one company you may also have a Company filter option which works in the same way as the Group filter.
To only show records from a specific group click into the Group field
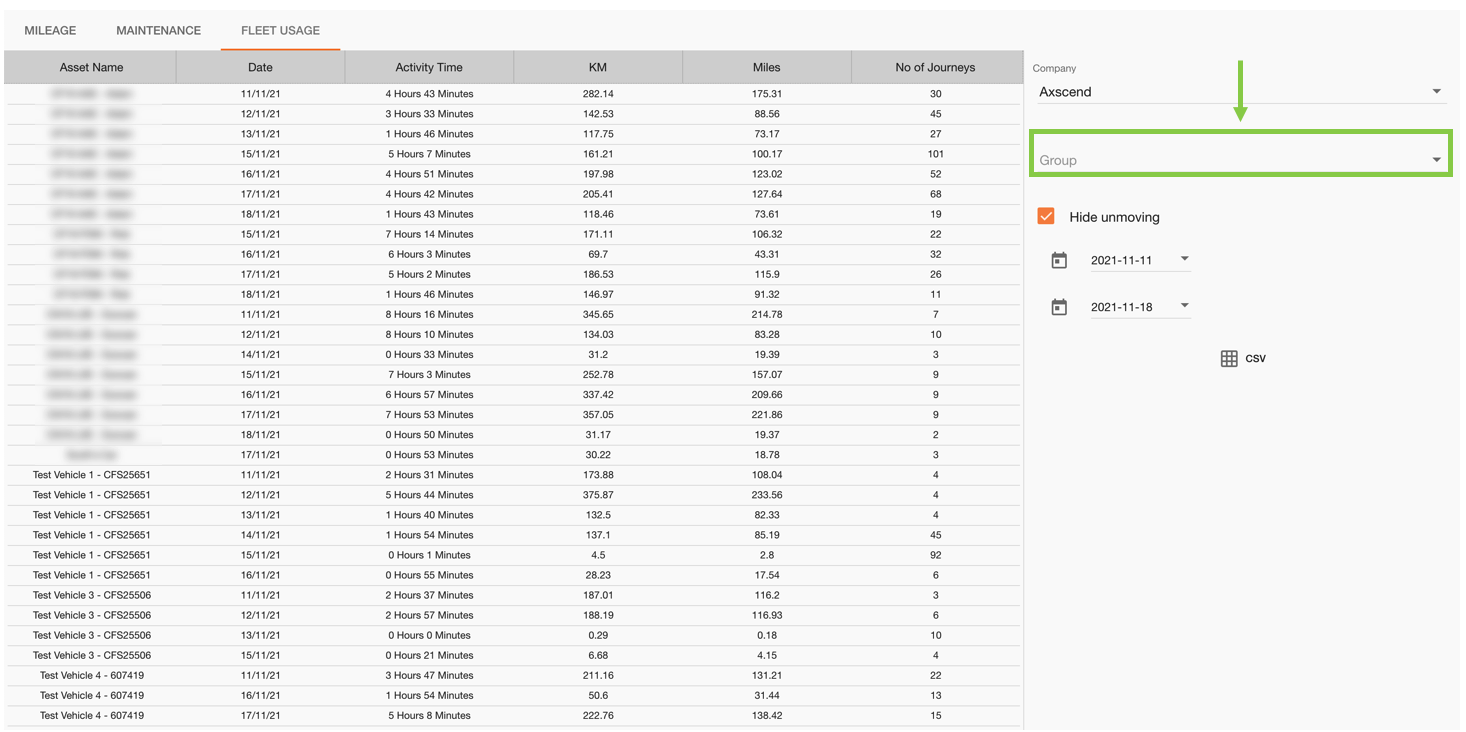
This will open the group dropdown menu, where you can select the required group.

Hide Unmoved Assets
You can show assets with no activity by unticking the ‘Hide Unmoving’ checkbox.

Shows the breakdown table which now includes assets with 0hr and 0min activity time, 0 KM and Miles and 0 journeys.
Vice-versa, you can hide assets with no activity by ticking the 'Hide Unmoving’ checkbox.

Shows the breakdown table which now excludes unmoving assets
Selecting a Date Range
You can select a different date range using the date pickers. The date fields show the current date filters applied to the table.

Click into the start or end date field and click on a day from the calendar. You can also scroll up or down the calendar to skip through the months.
The different styles of circles on the calendar:
The faded whole circle shows the day you have selected
The dark whole circle shows the date selected
The hollow outlined circle shows the current date.
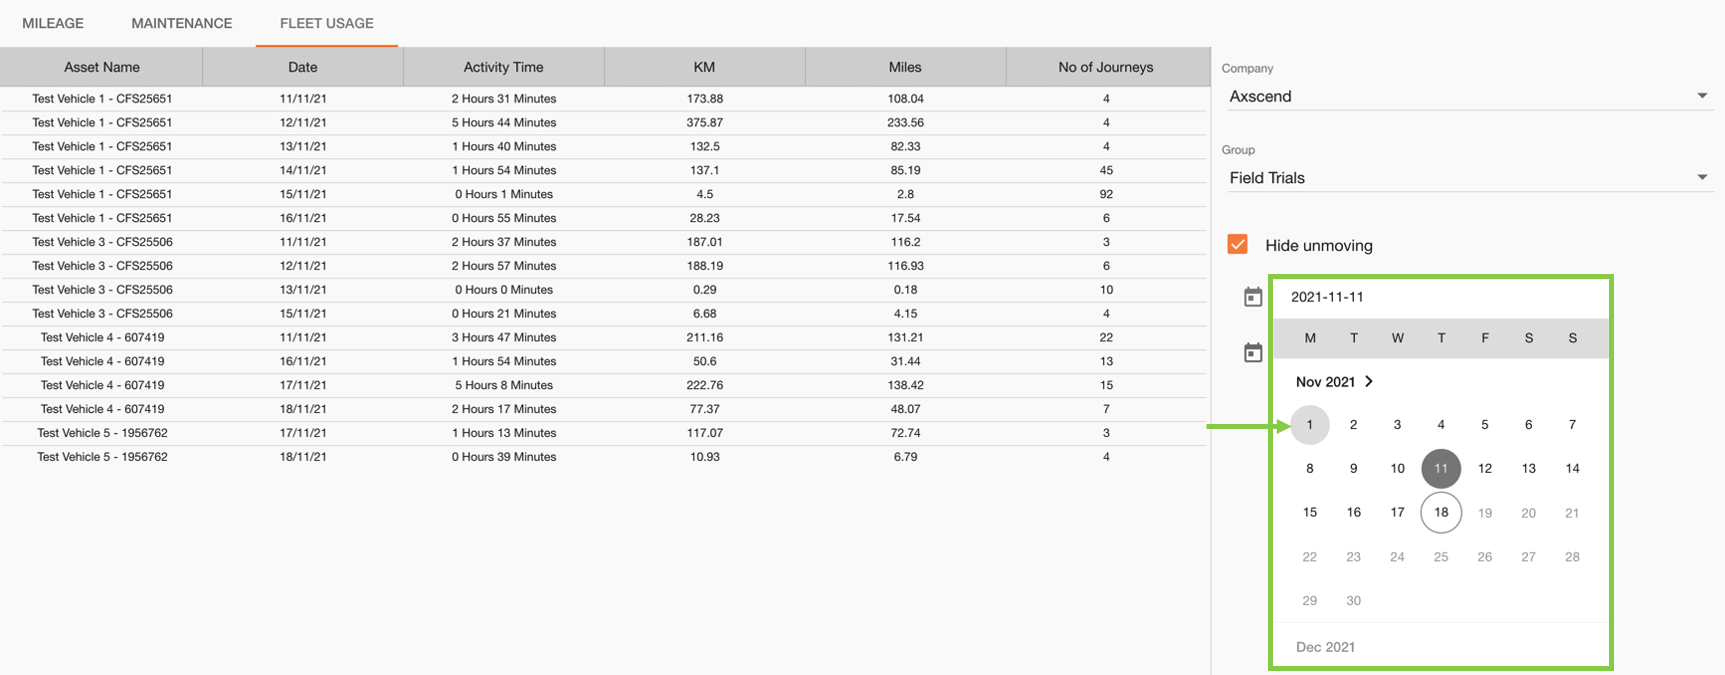
Once a date has been selected from the calendar, the breakdown table will automatically update to match the new date range selected.
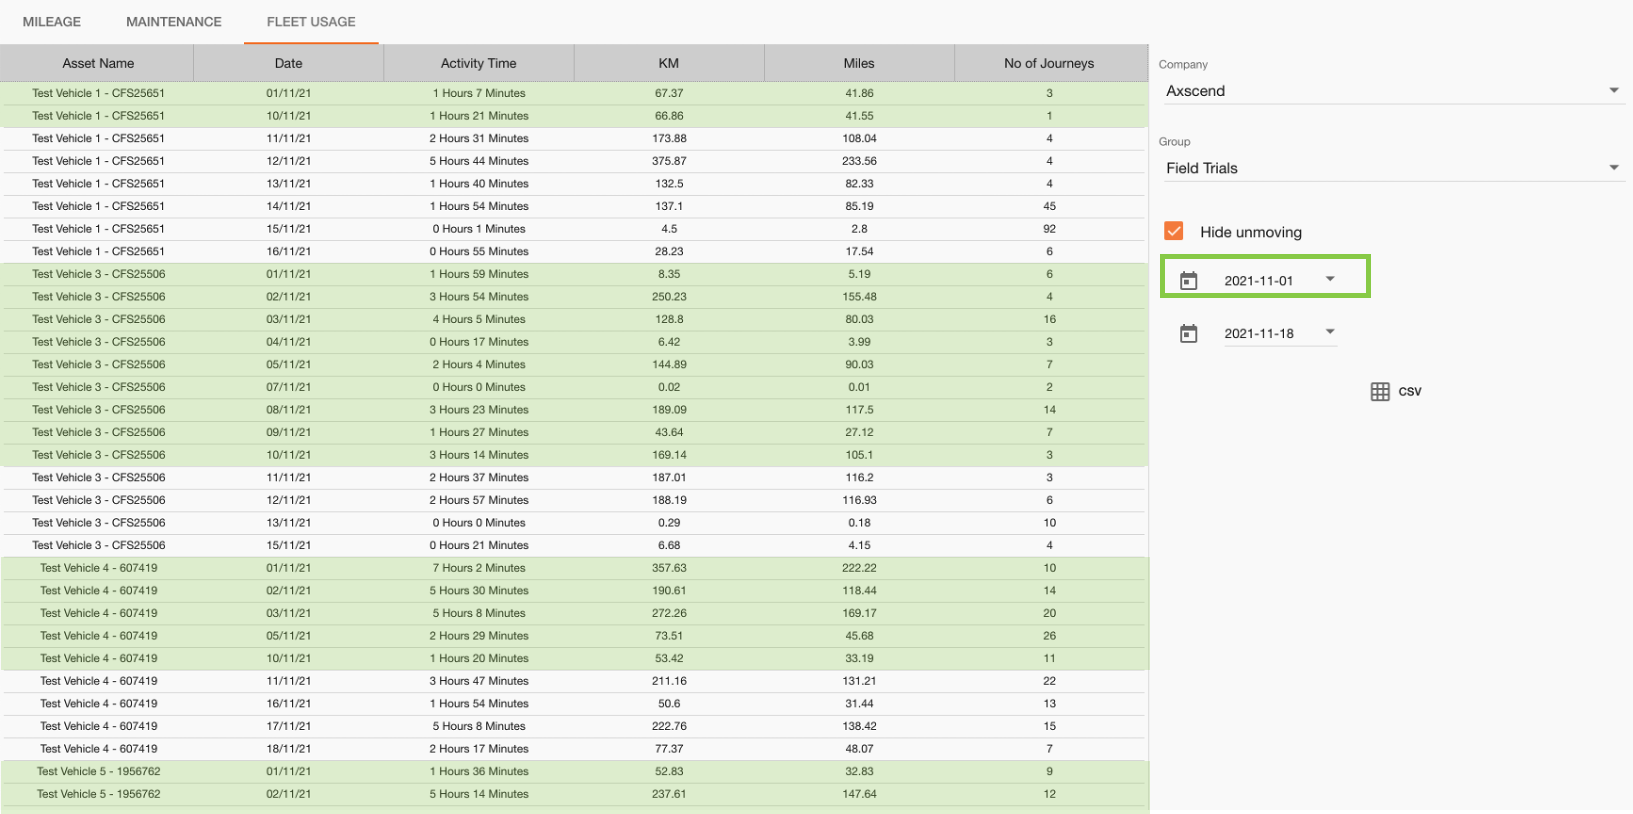
Shows the additional fields added - highlighting is for illustration only
Downloading Fleet Usage Reports
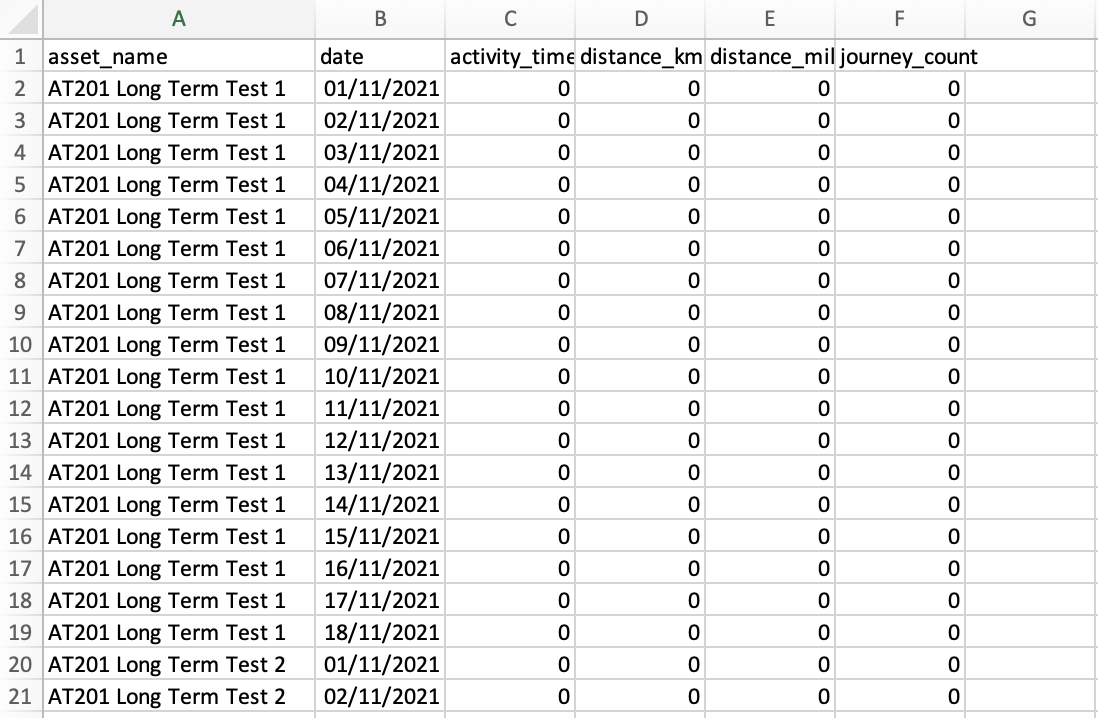
You can download a snapshot of the Fleet Usage table as a CSV report, which will include all the table headings as columns in the CSV.
The Group and Date filters applied to the table will also be applied to the report, however, the ‘Hide Unmoving’ checkbox won’t have an effect on the report.
To download the CSV report, click on the grid icon in the controls section.

This will begin downloading your report to your device.
 Troubleshooting
For any issues or errors that have not been solved please Contact Axscend Support.
.png)